OpenTelemetry Integration / Observability Backend
Problem
We want to notice misconfiguration, errors and changes in application performance as early as possible. To achieve this, we need to increase understanding of how our application works. Because it consists of multiple components where some are not developed by our team, monitoring the integration is more complex. We want all developers to be able to understand the whole stack and how it works together.
Constraints
- Should be self-hosted
- Should build on established standard
- Should be FLOSS
- Should be minimal effort to use/maintain
- Telemetry data comes from different environments (backend, db), services (keycloak), browsers (frontend)
- Should work with Trace, Log, Metrics data
Assumptions
- OpenTelemetry is the most used framework that supports our whole stack
- Interesting metrics are also available from Keycloak, Postgresql
Solutions
Based on the constrains following solutions are proposed:
Signoz
Pro:
- Satisfies all constraints.
- Is easy to setup.
- @e01506152 has already experience using it.
- Actively developed.
- Can notify on events/changes.
Cons:
- Single dependency (if project dies or changes license).
- Introduces a new service to maintain.
Grafana + Prometheus
Pro:
- Handles Tracing, Metric and Log data (OpenTelemetry Protocol)
- FLOSS
- Widely adapted.
Con:
- More complexity.
- Not all data on a single platform available.
- Unfamiliar with both tools.
- Introduces two new services to maintain.
- Timeconsuming to maintain
Grafana + CheckMK
Pro:
- Handles Tracing, Metric and Log data (OpenTelemetry Protocol)
- FLOSS
Con:
- More complexity.
- Not all data on a single platform available.
- Unfamiliar with both tools.
- CheckMK only in beta support.
- Introduces a new service to maintain.
Decision
| Solution | FOSS | Unified Data | Easy Setup | Familiarity | Maintenance Effort | Active Dev |
|---|---|---|---|---|---|---|
| Signoz | ✅ | ✅ | ✅ | ✅ (some) | ✅ (one service) | ✅ |
| Grafana + Prometheus | ✅ | ❌ | ❌ | ❌ | ❌ (two services) | ✅ |
| Grafana + CheckMK | ✅ | ❌ | ❌ | ❌ | ❌ (two services) | ⚠️ (beta) |
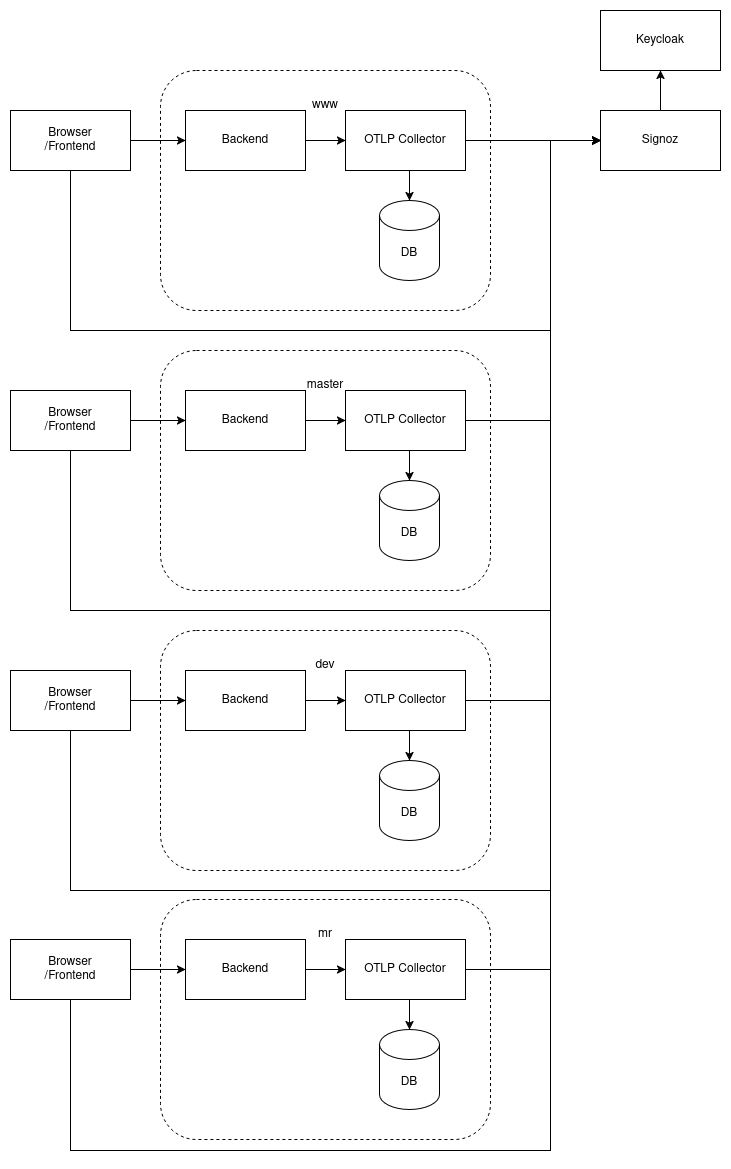
We will use Signoz as observability backend. It will ingest data from the OpenTelemetry Collector, as well as from the Keycloak and DB instances.
Rationale
It will provide a single platform to observe the application performance. This simplicity increases the likelihood that the team will adopt and use it effectively.
It has:
- Native support for the OpenTelemetry ecosystem
- Active development and strong community
- Out-of-the-box support for all required telemetry types
This makes it the easiest and lowest-effort solution to integrate and maintain.
Implications
- Our app (backend, frontend) needs to be configured to create Logs, Traces and Metric in the OpenTelemetry format.
- A server for running Signoz must be set up and maintained.
- Team needs documentation about Signoz and its basic usage patterns.
Related Decisions
We will deploy an OpenTelemetry Collector per environment.
Benefits:
- Decouples application code from the observability backend
- Increases scalability
- Enables flexible data enrichment (e.g., adding environment metadata)
Notes
Architecture proposal

Backend
We use the OpenTelemetrySDK and API for Rust to send the logs, traces and metrics to the OpenTelemetry Collector (local). The collector also ingests metrics directly from the local PostgreSQL instance. All telemetry data is enriched with metadata identifying its environment of origin
Frontend
We implement the OpenTelemetrySDK and API for Javascript to trace user interactions, fetching of resources and document loading times. The framework adds tracing headers to the requests made to our backend.
Keycloak
Signoz
Signoz has its own OTLP collector as receiving endpoint which needs to be configured to get the data from the metrics endpoint of the keycloak instance as well as allow the collection of telemetry received directly from the frontend sent from the users and the OTLP collectors of each permaplant environment.
Other Tools
Other APM tools like Grafana + Prometheus are OpenSource but are not one solution to deliver all the feature like Signoz. CheckMK only understands Metrics. Which is why we dont use it for observability.